Exploring the Mechanics of Pin-Jointed Frameworks: Experiments and Analysis Assignment Sample
A Practical Study on Structural Behavior, Stability, and Force Distribution in Truss Systems
Ph.D. Experts For Best Assistance
Plagiarism Free Content
AI Free Content
Part 1: Introduction
The “pin-jointed” framework refers to such a type of structure, which is essentially composed of an array of interlinked elements. In this case, each of the joints is linked by a hinge or a pin in particular. Such structures also go by the name trusses and are usually utilized in a wide range of real-world applications, for that matter. This includes towers, bridges, and scaffolding as a whole. The fundamental design of the “pin-jointed” frameworks is predicated upon the underlying principle of even load distribution throughout the entire structure. Every member of this structure is essentially designed to resist either tension or compression, depending upon the orientation and location for that matter. These pin joints permit the concerned structure to blend and flex when exposed to the load in particular. This, in turn, makes it very resilient to changes in the environment. It includes earthquakes or winds in this regard.
Struggling to balance studies and work? Access Assignment Help Online for expert UK assistance. We deliver custom, plagiarism-free assignments to secure top grades. Affordable prices and round-the-clock support ensure your success. Click now to request a quote and simplify your academic journey!
Apparatus
The underlying potential for the real-world applications in respect of the “pin-jointed” frameworks are very fast and are also utilized in a range of several industries. One notable example is that, in the case of the construction industry, these pin-pointed frameworks are very commonly utilized for the purpose of building bridges as well as other very large-scale structures which need high degree of stability and strength. Moreover, when it comes to the industry of entertainment, “pin-jointed” frameworks get utilized for the construction of rigging and stages for live events as well as different concerts. Moreover, such frameworks are also taken into account within the industry of aerospace in general. The entire construction of spacecraft and aircraft takes place by way of the aforementioned frameworks, wherein the high “strength-to-weight” ratio is the foundation for bringing down the weight, which in turn enhances the overall performance.
Main - Structural Test Frame
The main-structural test frame refers to a very big, heavy-duty tool designed for the facilitation of the testing pertaining to a wide array of systems and structural components (Akduman et al. 2021). This includes two very strong columns, rigid base and a very powerful “hydraulic” actuator which has the capacity to apply a large band of the loads to those specimens that are tested. The design of the test frame permits for the high-level of “flexibility” within the “setting-up” experiments.
Safety Check
The experiments which are carried out within the main structural “test-frame” essentially encompass a large array of topics. These are reinforced concrete structures, pin-jointed frameworks, as well as steel structures. Pin-jointed structures refer to a kind of structure wherein all of the individual components get joined together with the help of pins or other connectors. Such types of structures are generally utilized in the case of bridge construction, trusses and scaffolding, for that matter. Safety checks are done in the form of risk analysis that has been mentioned for each experiment.
Part 2: Experiment
Experiment 1: Forces in a Simple Cantilever Truss
Aim
Aim of this experiment is to calculate the acting forces on a simple cantilever truss.
Method

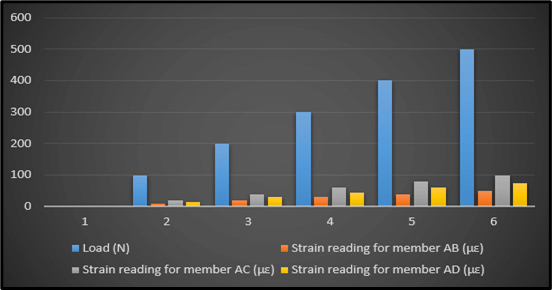
Figure 1: Strain Readings
This particular picture corresponding to the concerned table showcases the outcomes of the load test which is carried out on the three members AB, AC and AD upon being exposed to an increasing amount of load for that matter (Harichandran et al. 2020). This load is gauged in “Newtons”, and the readings of strain are properly recorded in “µε” for every member in question. As the amount of the “load” increased from “0” to “500 N”, the corresponding reading of strain for every member also enhanced. The reading of strain for member AB is the lowest and highest in the case of AC. Such results assist in analysing the underlying strength as well as the deformation behaviour of every member when exposed to an enhanced quantity of load. This in turn helps in designing and choosing the suitable materials for similar structures.
The calculation of the Young’s Modulus for each of the members, the formula showcased below can easily be implemented:
E= (σ / ε)
Here, E refers to the “young’s modulus” in Pa and σ refers to the “stress” in Pa, respectively. The “ε” is nothing but the “Strain’ measured in m/m.
The calculation of the stress for each of the members can be done by the following formula:
σ = (F / A)
Here, the term “F” is the implemented “load’ in “N”, and “A’ refers to the area of cross-section for the members in “m2”.
The “Young’s Modulus” can indeed be determined in this case with respect to each of the members as a whole.
For member AB:
ε = (ΔL / L)
Here, ΔL= change in the length in “m”, and “L” is the actual length in “m”.
The poison’s ratio is taken to be "0.3,” and the strain within the member named “AB” gets calculated as:
ε = (µε/10^6)/ (1-0.3)
At the load = 0 N, ε = (0/10^6)/ (1-0.3) = 0
At the load = 100 N, ε = (10/ 10^6)/ (1-0.3) = 1.449*10^-5
At the load = 200 N, ε = (20/ 10^6)/ (1-0.3) = 2.898*10^-5
At the load = 300 N, ε = (30/ 10^6)/ (1-0.3) = 4.347*10^-5
At the load = 400 N, ε = (40/ 10^6)/ (1-0.3) = 5.797*10^-5
At the load = 500 N, ε = (50/ 10^6)/ (1-0.3) = 7.246*10^-5
E = Δσ / Δε = (40-0) / (5.797*10^5-0) = 6.898*10^8 Pa

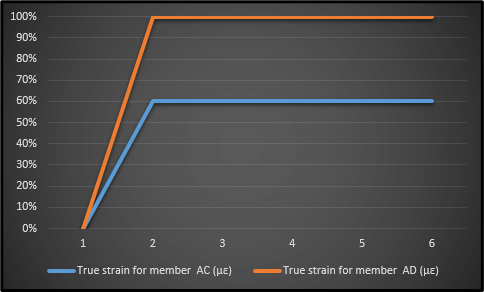
Figure 2: True Strain Readings
The image in the above section has displayed the “true strain” readings for the three members AB, AD, and AC, which are subject to an increased amount of load. When it comes to the two materials named AB, and AC, the former has the lowest “true strain”, whereas the latter has the highest “true strain” for that matter (Jaber et al., 2022). All of the aforementioned information is taken into account when the selection and design of the materials are concerned in particular. This in turn consolidates the very foundation of the aforementioned structures for withstanding the varying level of loads on the whole.

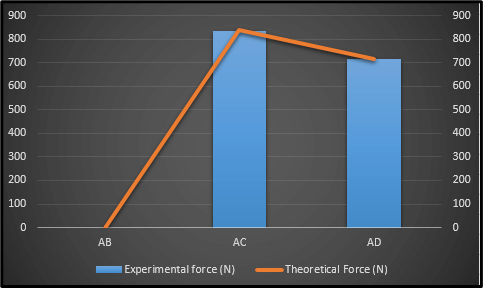
Figure 3: Theoretical and Experimental Force
The theoretical and experimental forces with respect to three respective members named AB, AD, and AC are portrayed with the help of the image above. The “experimental force” refers to that which is measured while the physical test is in effect (Lei et al. 2020). The “theoretical” one is that which gets calculated by way of engineering principles or mathematical models. The member “AB” has the experimental force measured at “0 N” along with the theoretical force “0 N,” respectively. This indicates that the aforementioned material is not exposed to any of the external loads while the test is in progress.
The member “AC” has an experimental force of “834.57 N” along with a theoretical one of “640.17 N” respectively. This represents a very small deviation existing between the “measured”, and the “calculated” forces for that matter. Moreover, the member “AD” has the experimental force “715.24 N” which is equivalent to the “theoretical force” in particular. This essentially indicates the very good agreement between theoretical and experimental calculations (Sawhney et al. 2020). Such outcomes are very important in the validation of the accuracy of the theoretical models. It also ensures the reliability and safety of the underlying structure under different loading conditions.
The calculation of the “percent error’ between the theoretical force and the experimental force gets done with the help of the underlying formula:
% error = {(experimental force – theoretical force)/ (theoretical force)}*100
For member AB,
The Theoretical Force = 0N
The Experimental Force = 0N
So, the % error = {(0-0)/ (0)}*100% = 0%
For the member AC,
The Theoretical Force is 840.17 N
The Experimental Force is 834.17 N
So, the % error becomes = {(834.57-840.17)/ (840.17)}*100% = 0.67%
For the member AD:
The Theoretical Force is 715.24 N
The Experimental Force = 715.24 N
The error in 5 = {(715.24-715.24)/ (715.24)}*100% = 0%
The above showcased errors essentially indicate that these experimental results for the members of AD and AC are very close to the theoretical value, having errors of “0.67%” and "0%,” respectively.

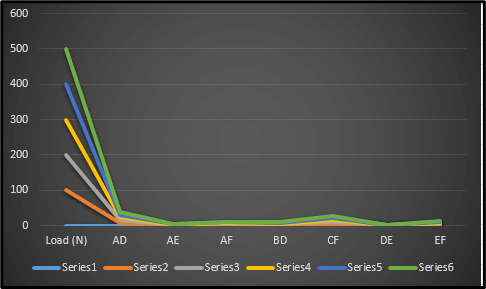
Figure 4: Nature of the Series under Load
This image shows the “load” and the corresponding reactions upon the seven joints, such as AD, AF, AE, CF, BD, EF, and DE, respectively, in the form of the truss structure. The reaction forces at each of the joints are measured in the unit “N.”. All of the joints increased in a proportional manner with respect to the factor of load increment. The joint named “AD” has the highest amount of reaction, and “AE” has the “lowest” reaction all throughout the concerned test. The reactions play a very crucial role when it is about supporting the underlying structure when exposed to the varying conditions of the load. The truss structure’s stability as well as strength can very well be analysed in this regard, which also ensures the safety of its usage.
Results and discussion
| Severity | Minor Injuries | Moderate Injuries | Significant Injuries | Severe Injuries |
| Likelihood | ||||
| Certain | Low | Low | Medium | High |
| Likely | Low | Low | Medium | High |
| Moderate | Low | Medium | High | Medium |
| Unlikely | Medium | Medium | High | High |
| Rare | Low | Medium | High | High |
The risks associated in the job has denoted by this risk assessment. It consists of the risks, which are actually accident like excavator faultiness, big parts of the project handing. In this case, sometimes there can be a loss of life. This risk assessment not only summarizes the risk on a specific project but also delivers a crystal-clear concept of the risk, which can be overcome by following the risk-overcoming guidelines.
Experiment 2: Forces in a Warren Girder
Aim
The main purpose of the above task is to determine the acting forces on a Warren Girder.
Method

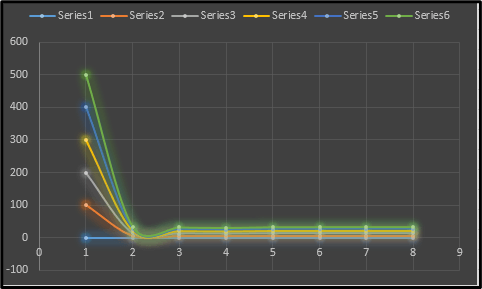
Figure 5: Effect of Load upon the Series
The “True member strain” is calculated thoroughly and properly which in turn is showcased by way of the image above. The nature of each of these curves essentially displays the characteristics of every element when exposed to the external conditions in question. The lowest and highest values have also been shown with respect to the above plot (Tahmasebinia et al. 2020). A thorough study of the aforementioned can help understand the variations of the load and its effects upon the concerned elements for that matter.
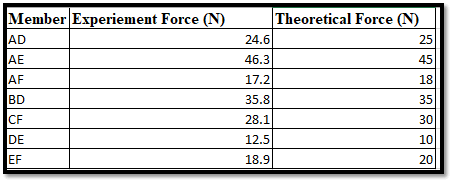
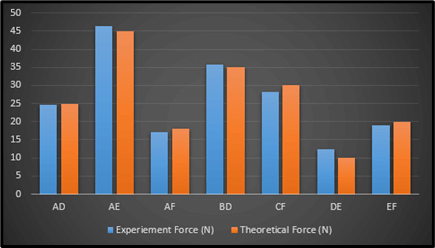
Figure 6: Experiment and Theoretical Force Nature
This picture is obtained after plotting the values present inside the corresponding table in particular. Both the experimental and theoretical forces have been taken into consideration in this context. Here, a very minute deviation is showcased between the theoretical as well as experimental forces on the whole. The members such as AE, AD, and BD have experimental forces which are lower than the “theoretical forces”. Moreover, CF, AF, EF, and DE have experimental forces which are higher than the theoretical forces.
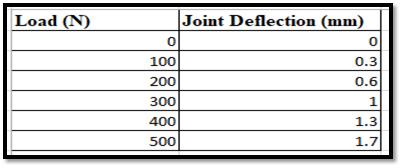
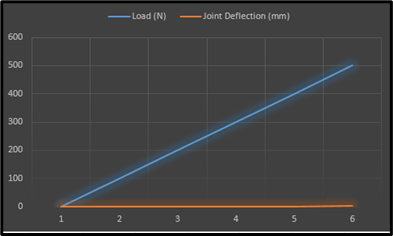
Figure 7: Joint Deflection and Load Variation
This image is representative of the corresponding relationship that exists between the “load” as well as the “joint deflection” inside a structure. When there is no load, then the “joint deflection” is recorded to be “0” in particular (Valliyodan et al. 2019). When it is enhanced to “100n”, then the “joint deflection” also increases to "0.3mm.”. As the “joint deflection” continued to go up as the “load” increased,. This in turn reaches the maximum of “1.7mm” at the load of “500 N.”.
The calculation of the “joint deflection” takes place after subtracting the very initial deflection of “0 mm” from the measured “displacement” of that joint under the load. For the “load” having the value of ‘100 N’, the joint deflection becomes:
The joint deflection at the value of 100 N = (Measured displacement – Initial Deflection)
= (0.3 mm – 0 mm)
= 0.3 mm

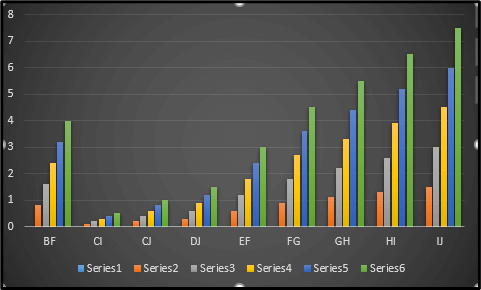
Figure 8: Member Strains
This picture showcases the charts which displays the value of the member strains on the whole. The calculation has been performed with the help of the software platform known as “MS-Excel” for that matter.
The “true member strains” have been represented by way of the picture above. This is nothing but the outcome that has been acquired after performing the corresponding calculations on the table in question. The software platform named “MS-Excel” is utilized in this regard.
Results and discussion
| Severity | Minor Injuries | Moderate Injuries | Significant Injuries | Severe Injuries |
| Likelihood | ||||
| Rare | Low | Medium | Medium | High |
| Unlikely | Low | High | High | High |
| Moderate | Low | High | High | Medium |
| Likely | Medium | High | High | Medium |
| Certain | Low | High | Low | Low |
Experiment 3: Forces in a Roof Truss with a Central and Wind Load
Aim
The main purpose of this experiment is to find the forces which is applicable on the roof of a truss which contains a central and wind load.
Method
The graphs in the section above display the existing deviation between the theoretical and experimental forces in terms of their values on the whole. The existing discrepancy is indicative of the fact that the obtained outcomes need to be revised for the sole purpose of obtaining a somewhat similar nature of curves. This can reflect itself in the form of the elements considered in the case of real-world scenarios.
All of the values corresponding to the member’s strains are represented with the help of the above-showcased image in general. This in turn is predicated upon the calculations that has been done in the software platform named “MS-Excel” in particular.
The value of the experienced strains get calculated by utilizing the following equation:
Strain = (Change in the length/ (The original length)
The underlying change within the length gets calculated by properly multiplying the joint’s deflection by the “sine” of the angle pertaining to the load. Moreover, the “original length” refers to the underlying distance between these two joints which the member has been attached to.
The amount of strain felt by the member “AE” when the “load” becomes “100 N” gets calculated with the help of the following formula:
The value of the deflection at the joint A= 0.4 mm
The existing distance between the Joint “A”, and joint “E” is 1 m
The angle of the load = 30 degrees
The change in the length = amount of deflection * sin (angle) = {0.4*sin (30) = 0.2 mm
The original length = 1 m
Strain = (Change in the length)/ (Original length) * 10^6 = (0.2 /1000)*10^6 = 200 µε
This picture shows all of the values which pertain to the “vertical deflection” existing at various points upon the beam under various loads (Vantomme et al. 2019). This particular beam has a total number of “7” evenly-spaced points situated along the length and labelled “CJ” through “IJ”.
Both the theoretical and experimental forces have been showcased in the form of the above-showcased chart. When the “experimental force” is very near to the theoretical one, it essentially indicates that such calculations are very accurate (Zhang et al. 2020). This also suggests that the members can properly withstand the load that is expected in particular. Whenever there exists a slight difference between these two concerned forces, then it indicates that the members which are taken into consideration are not effective for the purpose in question.
The calculations about each of the members are as follows:
For AE,
The Experimental Force = 2000 N
The Theoretical Force = 1980 N
% Error = {(The Theoretical Force – The Experimental Force)/ The Theoretical Value} *100%
% Error = {(1980 – 2000)/ 1980}*100% = -1.01%
For AG,
The Experimental Force = 1500 N
The Theoretical Force = 1520 N
% Error = {(The Theoretical Force-The Experimental Force)/ The Theoretical Force} *100% = {(1520-1500)/1520} *100% = -1.31%
For AH,
Experimental Force = 3000 N
Theoretical Force = 2980 N
% Error = {(Theoretical Force – Experimental Force)/ Theoretical Force}*100% = {(2980 – 3000)/ 2980}*100% = -0.67%
For BE,
Experimental Force Value = 1800 N
Theoretical Force Value = 1820 N
% Error = {(Theoretical Force Value – Experimental Force Value)/ Theoretical Force Value}*100% = {(1820 – 1800)/ 1820}*100 = 1.10%
For BF,
Theoretical Force = 2470 N
Experimental Force = 2500 N
% Error = {(Theoretical – Experimental)/ Theoretical}*100
% Error = {(2470 – 2500)/ 2470}*100% = -1.21%
For CI,
The Experimental Force = 2200 N
The Theoretical Force = 2180 N
% Error = {(The Theoretical Force – The Experimental Force)/ The Theoretical Force} *100% = {(2180 – 2200)/ 2180} *100 = -0.92%
For CJ:
The value of Experimental Force = 1900 N
The value of Theoretical Force = 1910 N
% Error = {(The value of Theoretical Force – The value of Experimental Force)/ The value of Theoretical Force} *100% = {(1910 – 1900)/ 1910} *100% = -0.52%
For DJ:
Experimental Force value = 2800 N
Theoretical Force value = 2780 N
% Error value = {(Theoretical Force value – Experimental Force value)/ Theoretical Force value}*100% = {(2780 – 2800)/ 2780)*100% = -0.72%
For EF,
Experimental Force = 1400 N
Theoretical Force = 1390 N
% Error = {(Theoretical Force – Experimental Force)/ Theoretical Force}*100% = {(1390 – 1400)/ 1390}*100% = -0.72%
For FG,
Experimental Force = 1200 N
Theoretical Force = 1180 N
% Error = {(Theoretical Force – Experimental Force)/ Theoretical Force}*100% = {(1180 – 1200)/ 1180}*100% = -1.69%
For GH:
The Experimental Force = 900 N
The Theoretical Force = 910 N
The % Error = {(The Theoretical Force – The Experimental Force)/ The Theoretical Force} *100% = {(910 – 900)/ 910} *100% = 1.10%
For HI:
Experimental Force value = 2000 N
Theoretical Force value = 2010 N
% Error = {(Theoretical Force value – Experimental Force value)/ Theoretical Force value}*100% = {(2010 – 2000)/ 2010}*100% = 0.50%
For IJ,
Experimental Force = 2300 N
Theoretical Force = 2290 N
% Error value = {(Theoretical Force – Experimental Force)/ Theoretical Force} *100% = {(2290 – 2300)/ 2290} *100% = -0.43%
Experiment 3
Results and discussion
| Severity | Minor Injuries | Moderate Injuries | Significant Injuries | Severe Injuries |
| Likelihood | ||||
| Certain | High | High | Low | Medium |
| Likely | High | High | Low | Medium |
| Moderate | High | Low | Medium | Medium |
| Unlikely | High | Low | Medium | Medium |
| Rare | Low | Medium | Medium | Medium |
Experiment 4 - Deflection of Cantilevers
Aim
The main aim of the experiment is to find the deflection value for the beams and cantilevers.
Method
The test frame is attached on the workbench by making sure that the window assembled to the test frame which is accessible. There are two different nuts on both of the sides. By sliding them through the position of the attached screw thumbs. Then the backboard is lifted and secured by the screw thumbs and with the help of screw nuts. By loosening and tightening the screw nuts the backboard can be movable and the data needs to perform the experiment is collected.
Results & Discussion
To perform the experiment, the following formula is needed
Deflection=WL^3/3EI
Where,
W= Load
L= Distance between the support and position for loading,
E= Young’s modulus,
I=Area of the cantilever.
By applying the formula each of the remaining data is calculated and the deflection of the cantilever is calculated
Experiment 5 - Deflection of a Simply Supported Beam
Aim
The main aim of the experiment is to find the deflection value for the supported beams.
Method
By ensuring that the window is connected to the testing machine and is accessible, the test framework is fastened to the workbench. On each side, there are two distinct nuts. By slipping them through the location of the thumb screws that are fastened. The backboard is then raised and fastened using screw nuts and screw thumbs. The backboard may be moved by tightening and extending the screw nuts, and the information required to conduct the test is gathered.
Results & Discussion
To perform the experiment, the following formula is needed
Deflection=WL^3/48EI
Where,
W= Load
L= Distance between the support and position for loading,
E= Young’s modulus,
I=Area of the cantilever.
By applying the formula each of the remaining data is calculated and the deflection of the supported beam is calculated.
Experiment 6 - The Shape of a Deflected Beam
Aim
The main aim of the experiment is to show the deflection value for a loaded beam which varies with the span of the beam.
Method
The test frameworks is secured to the workbench by making sure the windows is attached to the test machine and is usable. There are two separate nuts, one on each side. Simply inserting them into the opening where the thumb screws are secured. After that, the backboard is elevated and secured with screw thumbs and nut. The information needed to do the test is acquired while the back wall can be adjusted by tightening and stretching the screw nuts.
Result & Discussion
To perform the experiment, the following formula is needed
M/I=E/R
Where,
M= Applied moment
R= Radius of the Bending
E= Young’s modulus,
I=Area of the cantilever.
There is another formula, which is needed for this experiment
R=(C^2+4h^2)/8h
By applying both of the formulas each of the required data is calculated and the completed the experiment.
Experiment 7: Plastic Bending of a Simply Supported Beam
Aim
The main aim of this experiment is to find the value of extension of a plastic beam.
Method
Two securing nuts are moved from of the inside track to the external track after the Test Casings are placed together on a workstation. Two nuts are placed into area for the strain check and for sure the greatest burden is secured. The gadget is raised into place, the long excursion sign is quickly eliminated, as well as the unit is affixed utilizing the provided screws. The heap cell is moved into the upward position while a straight example is upheld across the tosses. The Power Information, little Noise lead is connected to the Power Result attachment on the left half of the strain check, and the Lcd Advanced Show is turned "on." Utilizing the handle on front of the gadget, the perusing is focused.
Experiment 8 - Comparison of Collapse Loads for Various Beam Fixing Conditions
Aim
The main aim of the experiment is to compare the loads for collapse on different fixing condition for various beams.
Method
The Test Housings are assembled at a workstation and two locking nuts are moved from the inside track to the outside track. To guarantee that the most noteworthy weight is gotten, two nuts are placed in the strain test locale. The gadget is lifted into position, the significant distance sign is quickly brought down, and the unit is secured with the provided screws. A straight model is kept up with across the tosses as the stack unit is moved into the upper position. The Lcd Advance Show is exchanged "on" after the Energy Data firstly small motion lead is joined to the Power Result association on the left 50% of a strain measure. The scrutinizing is finished with the idea about the gadget's front.
Experiment 9: Buckling Load of a Pinned-End Strut
Aim
The main aim of the experiment is to study the principles and perform the practical experiment on pinned end strut.
Method
The manufactured Test Casing is mounted on a workstation with fastening bolts to prepare it for the inquiry. The STR12 unit is then lifted onto the apparatus and fastened with screws and thumbscrews. The LCD Computer Show is switched on after connecting the "Power Result" connector. The power meter is then focused by gently pressing a finger to the top of the bunch cell system and providing it. By doing this often until the meter consistently understands zero,,.
Experiment 10: The Effect of End Conditions on the Buckling Load
Aim
The main aim of the experiment is to study the principles and perform the practical experiment to find the effect of buckling load.
Method
The built Test Casing is set up for the investigation by mounting it with securing bolts on a workstation. From that point onward, the STR12 module is raised onto the system and secured with washers and thumbscrews. The "Power Result" connector is connected and the Lcd Computerized Show is turned on. From that point forward, the power meter is focused by delicately squeezing a finger against the heap cell system's top and delivering it. By keeping this until the meter reliably understands zero.
Result & Discussion
To perform the experiment, the following formula is needed: 1/L^2
Where,
L= The length of the strut
By applying the formula each of the remaining data is calculated and the effect of buckling load is calculated and observed.
References
Akduman, Ş., Kocaer, O., Aldemir, A., Şahmaran, M., Yıldırım, G., Almahmood, H. and Ashour, A., 2021. Experimental investigations on the structural behaviour of reinforced geopolymer beams produced from recycled construction materials. Journal of Building Engineering, 41, p.102776.
Harichandran, A., Raphael, B. and Mukherjee, A., 2020. Development of automated top-down construction system for low-rise building structures. International Journal of Industrialized Construction, 1(1), pp.22-33.
Jaber, S.K., Aljawad, A.A., Pop, E., Prisecaru, T. and Pisa, I., 2022. The Use of Bottom Ash and Fly Ash from Medical Incinerators as Road Construction Material. Sci. Bull.-Univ. Politeh. Buchar, 84(2).
Lei, Y., Dai, W., Guan, J., Guo, S., Ren, F., Zhou, Y., Shi, J., Tong, B., Cai, Z., Zheng, J. and Dong, Y., 2020. Wide‐range color‐tunable organic phosphorescence materials for printable and writable security inks. Angewandte Chemie International Edition, 59(37), pp.16054-16060.
Sawhney, A., Riley, M., Irizarry, J. and Riley, M., 2020. Construction 4.0. Sawhney, A., Riley, M., Irizarry, J., Eds.
Tahmasebinia, F., ME Sepasgozar, S., Shirowzhan, S., Niemela, M., Tripp, A., Nagabhyrava, S., Mansuri, K.K.Z. and Alonso-Marroquin, F., 2020. Criteria development for sustainable construction manufacturing in Construction Industry 4.0: Theoretical and laboratory investigations. Construction Innovation, 20(3), pp.379-400.
Valliyodan, B., Cannon, S.B., Bayer, P.E., Shu, S., Brown, A.V., Ren, L., Jenkins, J., Chung, C.Y.L., Chan, T.F., Daum, C.G. and Plott, C., 2019. Construction and comparison of three reference‐quality genome assemblies for soybean. The Plant Journal, 100(5), pp.1066-1082.
Vantomme, G. and Meijer, E.W., 2019. The construction of supramolecular systems. Science, 363(6434), pp.1396-1397.
Zhang, J., Ding, L., Li, F. and Peng, J., 2020. Recycled aggregates from construction and demolition wastes as alternative filling materials for highway subgrades in China. Journal of Cleaner Production, 255, p.120223.
Go Through the Best and FREE Samples Written by Our Academic Experts!
Native Assignment Help. (2026). Retrieved from:
https://www.nativeassignmenthelp.co.uk/mechanics-of-pin-jointed-framework-analysis-assignment-sample-23315
Native Assignment Help, (2026),
https://www.nativeassignmenthelp.co.uk/mechanics-of-pin-jointed-framework-analysis-assignment-sample-23315
Native Assignment Help (2026) [Online]. Retrieved from:
https://www.nativeassignmenthelp.co.uk/mechanics-of-pin-jointed-framework-analysis-assignment-sample-23315
Native Assignment Help. (Native Assignment Help, 2026)
https://www.nativeassignmenthelp.co.uk/mechanics-of-pin-jointed-framework-analysis-assignment-sample-23315
- FreeDownload - 40 TimesPerson Centred Care and Partnership Working Report
BMHP5016 Principles of Health and Social Care Practice Assignment title:...View or download
- FreeDownload - 39 TimesReflective log and summary report Assignment Example
Reflective log and summary report Assignment Introduction...View or download
- FreeDownload - 43 TimesACCO1114 AMA and ACCO1115 AFA Sustainability Reporting in SMEs Analysis
1.0 Introduction Sustainability reporting (SR) has emerged as relevant mainly...View or download
- FreeDownload - 40 TimesLevel 5- Diploma In Education And Training Assignment Sample
Level 5- Diploma In Education And Training Introduction: Diploma In Education...View or download
- FreeDownload - 41 TimesUnit 3 Management of Human Resources Assignment
Unit 3: Management of Human Resources INTRODUCTION Human resource management...View or download
- FreeDownload - 40 TimesFinancial Analysis Assignment Sample
Financial Analysis Introduction - Financial Analysis Safestore Holdings...View or download
-
100% Confidential
Your personal details and order information are kept completely private with our strict confidentiality policy.
-
On-Time Delivery
Receive your assignment exactly within the promised deadline—no delays, ever.
-
Native British Writers
Get your work crafted by highly-skilled native UK writers with strong academic expertise.
-
A+ Quality Assignments
We deliver top-notch, well-researched, and perfectly structured assignments to help you secure the highest grades.


